Instruction for
experiments
The experiments are conducted
based on Sarkar et al.�s approach. The starting images are prepared as
concluded below. For example for the experiment for compressed images at QF100:
1.
Compress the
images in databases to JPEG at QF75, by using code : ( click at filename to download )
-
comp1.m – to compress the UCID images in
folder �UCID1338� to be 512×384 pixels JPEG QF75 for folder �UCIDQF75�, the
file names are in number run from 1 to 1338.jpg
-
comp2.m – to compress the UCUS images in
folder �UCUS1009� to be 512×384 pixels JPEG QF75 for folder �UCUSQF75�, the
file names are in number run from 1 to 1009 .jpg
2.
Prepare decompressed
images before seam modifications.
-
decomp1.m – to decompress the UCID images in
�UCIDQF75� for folder �UCIDQ75TIF�, and ready for retargeting the images.
-
decomp2.m
– to decompress the UCUS images in
�UCUSQF75� for folder �UCUSQ75TIF�, and ready for retargeting the images.
3.
Retarget the
images in step 2 by using seam modifications for each different tamper rates
and classify into different dataset namely, 1%, 2%, 5%, 10%, 20%, 30%, 50% and
mixed set.
v For example, retargeting the UCID images with
1% seam carving; the needed codes are:
-
doEdge.m called by mQF100byUCIDQ75TIFC01.m
-
doDownEnergy.m called by mQF100byUCIDQ75TIFC01.m
-
mQF100byUCIDQ75TIFC01.m – to retarget the images by 1% seam
carving rate. This code can be applied for others seam carving rate by changing
the operand of 1-0.99 in line 15.
Line 14: % Seam carving rate 1% = 1-0.99 retargeting
Line 15: cut_num =
floor(n*(1-0.99));
For instance,
2% seam carving rate must change the operand 0.99 to be 0.98,
5% seam carving rate must change the operand 0.99 to be 0.95,
10% seam carving rate must change the operand 0.99 to be 0.9,
20% seam carving rate must change the operand 0.99 to be 0.8,
30% seam carving rate must change the operand 0.99 to be 0.7,
and
50% seam carving rate must change the operand 0.99 to be 0.5.
The images in target path �QF100forUCIDQ75TIFC01� are named by number
run from 1339 to 2676 .jpg and resulted at QF100.
Line 66: % File names are resulted in number run from 1339 to
2676 .jpg
Line 67: outName= ['./QF100byUCIDQ75TIFC01/',num2str(pic+1338),'.jpg'];
v For example, retargeting the UCUS images with
1% seam insertion; the needed codes are:
-
doEdge2.m called by mQF100forUCIDQ75TIFI01.m
-
doDownEnergy.m called by mQF100forUCIDQ75TIFI01.m
-
mQF100byUCIDQ75TIFI01.m – to retarget the images by 1% seam insertion
rate. This code can be applied for others seam insertion rate by changing the
operand of n_o * 0.01 in line 16.
Line 15: % Seam insertion rate 1% = n_o * 0.01 retargeting
Line 16: cut_num =
floor(n_o * 0.01);
For instance,
2% seam carving rate must change the operand 0.01 to be 0.02,
5% seam carving rate must change the operand 0.01 to be 0.05,
10% seam carving rate must change the operand 0.01 to be 0.1,
20% seam carving rate must change the operand 0.01 to be 0.2,
30% seam carving rate must change the operand 0.01 to be 0.3,
and
50% seam carving rate must change the operand 0.01 to be 0.5.
The images in target path �QF100forUCUSQ75TIFI01� are named by number
run from 1010 to 2018 .jpg and resulted at QF100.
Line 106: % File names are resulted in number run from 1010 to
2018 .jpg
Line 107: outName= ['./QF100byUCUSQ75TIFI01/',num2str(pic+1009),'.jpg'];
4.
Compress the
retargeted images to be JPEG at QF100 before passing through the detection
process.
-
By mQF100forUCIDQ75TIFC01.m, can be found at
Line 70: % Compressed rate at Quality 100 --> QF100
Line 71: imwrite(targetImg,
outName, 'Quality', 100);
-
By mQF100forUCIDQ75TIFI01.m, can be found at
Line
109: % Compressed rate at Quality
100 --> QF100
Line
110: imwrite(targetImg, outName, 'Quality', 100);
5.
Calculate
the matrix to show the symmetry phenomena in blocking effects.
5.1.
Read the JPEG
images obtained by compressing at QF75 (the original images dataset), and the
images obtained by seam modifications (the tamper images dataset) into the
calculation process by using code:
-
BACMQF100UCIDC01.m, is prepared to read the data from the
original images data and tamper images datasets.
Line 4: % How many images you want to analysis
Line 5: numPic =
1338+1338;
�
Line 15: % The images' paths
Line 16: % For the original images and tamper images dataset
Line 17: if pic < 1339;
Line 18: sourceName= ['./UCIDQF75/',num2str(pic),'.jpg'];
Line 19: else
Line 20: sourceName= ['./QF100byUCIDQ75TIFC01/',num2str(pic),'.jpg'];
Line 21: end
Line 22: img=
imread(sourceName);
�
5.2.
Analyze the
BACM data and output as .txt file.
Line 258: % The analyzed data output
Line 259: [fid,message] =
fopen('BACMQ100UCIDC01.txt','w+');
�
Line 263: % How many modified images in the dataset
Line 264: if i>1338
�
6.
Train the
BACM to create a training model for cross validation test. In our example here,
we train the data by
-
svm-train.exe command in libsvm-3.14 or libsvm-3.17
package. The command is found in subfolder windows (libsvm-3.14/windows). Train
the �BACMQF100UCIDC01.txt� to create �BACMQ100UCIDC01.txt.model�.
-
For instance
of the command lines for training, and the results were captured and
demonstrated below:
Phoenix:windows Phoenix$ svm-train BACMQ100UCIDC01.txt
..*.*
optimization finished, #iter = 3390
nu = 0.376003
obj = -726.115364, rho = 0.307937
nSV = 1696, nBSV = 576
Total nSV = 1696
Phoenix:windows Phoenix$ svm-train BACMQ100UCIDC02.txt
..*.*
optimization finished, #iter = 3410
nu = 0.338551
obj = -653.582775, rho = 0.259299
nSV = 1617, nBSV = 476
Total nSV = 1617
Phoenix:windows Phoenix$ svm-train BACMQ100UCIDC10.txt
.*.*
optimization finished, #iter = 2396
nu = 0.178951
obj = -311.840801, rho = -0.153669
nSV = 1044, nBSV = 187
Total nSV = 1044
Phoenix:windows Phoenix$ svm-train BACMQ100UCIDC20.txt
.*
optimization finished, #iter = 1900
nu = 0.108905
obj = -183.776140, rho = -0.477221
nSV = 812, nBSV = 117
Total nSV = 812
Phoenix:windows Phoenix$ svm-train BACMQ100UCIDC30.txt
*.*
optimization finished, #iter = 1488
nu = 0.063856
obj = -108.088860, rho = -0.698763
nSV = 683, nBSV = 74
Total nSV = 683
Phoenix:windows Phoenix$ svm-train BACMQ100UCIDC50.txt
*.*
optimization finished, #iter = 1090
nu = 0.025790
obj = -45.448209, rho = -0.895734
nSV = 575, nBSV = 34
Total nSV = 575
Phoenix:windows Phoenix$ svm-train BACMQ100UCIDMixed7C.txt
.*.*
optimization finished, #iter = 2763
nu = 0.236235
obj = -423.774780, rho = 0.069050
nSV = 1216, nBSV = 252
Total nSV = 1216
7.
Cross
validation test by
-
svm-predict.exe command in libsvm-3.14 or libsvm-3.17
package. The command is found in subfolder windows (libsvm-3.14/windows).
-
For instance
of the command lines for cross validation test, and the results were captured
and demonstrated below:
%
cross validation test that tested by BACMQ100UCIDC01.txt.model for all
test dataset
Phoenix:windows Phoenix$ svm-predict BACMQ100UCIDC01.txt BACMQ100UCIDC01.txt.model
testQ100UCIDC01TC01.txt
Accuracy = 92.1151% (2465/2676)
(classification)
Phoenix:windows Phoenix$ svm-predict BACMQ100UCIDC02.txt BACMQ100UCIDC01.txt.model
testQ100UCIDC01TC02.txt
Accuracy = 92.2646% (2469/2676)
(classification)
Phoenix:windows Phoenix$ svm-predict BACMQ100UCIDC05.txt BACMQ100UCIDC01.txt.model
testQ100UCIDC01TC05.txt
Accuracy = 95.0673% (2544/2676)
(classification)
Phoenix:windows Phoenix$ svm-predict BACMQ100UCIDC10.txt BACMQ100UCIDC01.txt.model
testQ100UCIDC01TC10.txt
Accuracy = 96.8236% (2591/2676)
(classification)
Phoenix:windows Phoenix$ svm-predict BACMQ100UCIDC20.txt BACMQ100UCIDC01.txt.model
testQ100UCIDC01TC20.txt
Accuracy = 97.7952% (2617/2676)
(classification)
Phoenix:windows Phoenix$ svm-predict BACMQ100UCIDC30.txt BACMQ100UCIDC01.txt.model
testQ100UCIDC01TC30.txt
Accuracy = 98.1689% (2627/2676)
(classification)
Phoenix:windows Phoenix$ svm-predict BACMQ100UCIDC50.txt BACMQ100UCIDC01.txt.model
testQ100UCIDC01TC50.txt
Accuracy = 98.2063% (2628/2676)
(classification)
%
cross validation test that tested by BACMQ100UCIDC02.txt.model for all
test dataset
Phoenix:windows Phoenix$ svm-predict BACMQ100UCIDC01.txt BACMQ100UCIDC02.txt.model
testQ100UCIDC02TC01.txt
Accuracy = 89.574% (2397/2676)
(classification)
Phoenix:windows Phoenix$ svm-predict BACMQ100UCIDC02.txt BACMQ100UCIDC02.txt.model
testQ100UCIDC02TC02.txt
Accuracy = 92.9372% (2487/2676)
(classification)
Phoenix:windows Phoenix$ svm-predict BACMQ100UCIDC05.txt BACMQ100UCIDC02.txt.model
testQ100UCIDC02TC05.txt
Accuracy = 95.0299% (2543/2676)
(classification)
Phoenix:windows Phoenix$ svm-predict BACMQ100UCIDC10.txt BACMQ100UCIDC02.txt.model
testQ100UCIDC02TC10.txt
Accuracy = 96.9731% (2595/2676)
(classification)
Phoenix:windows Phoenix$ svm-predict BACMQ100UCIDC20.txt BACMQ100UCIDC02.txt.model
testQ100UCIDC02TC20.txt
Accuracy = 97.9447% (2621/2676)
(classification)
Phoenix:windows Phoenix$ svm-predict BACMQ100UCIDC30.txt BACMQ100UCIDC02.txt.model
testQ100UCIDC02TC30.txt
Accuracy = 98.3931% (2633/2676)
(classification)
Phoenix:windows Phoenix$ svm-predict BACMQ100UCIDC50.txt BACMQ100UCIDC02.txt.model
testQ100UCIDC02TC50.txt
Accuracy = 98.4305% (2634/2676)
(classification)
%
cross validation test that tested by BACMQ100UCIDC05.txt.model for all
test dataset
Phoenix:windows Phoenix$ svm-predict BACMQ100UCIDC01.txt BACMQ100UCIDC05.txt.model
testQ100UCIDC05TC01.txt
Accuracy = 88.1166% (2358/2676)
(classification)
Phoenix:windows Phoenix$ svm-predict BACMQ100UCIDC02.txt BACMQ100UCIDC05.txt.model
testQ100UCIDC05TC02.txt
Accuracy = 90.5082% (2422/2676)
(classification)
Phoenix:windows Phoenix$ svm-predict BACMQ100UCIDC05.txt BACMQ100UCIDC05.txt.model
testQ100UCIDC05TC05.txt
Accuracy = 95.6652% (2560/2676)
(classification)
Phoenix:windows Phoenix$ svm-predict BACMQ100UCIDC10.txt BACMQ100UCIDC05.txt.model
testQ100UCIDC05TC10.txt
Accuracy = 96.9731% (2595/2676)
(classification)
Phoenix:windows Phoenix$ svm-predict BACMQ100UCIDC20.txt BACMQ100UCIDC05.txt.model
testQ100UCIDC05TC20.txt
Accuracy = 98.281% (2630/2676)
(classification)
Phoenix:windows Phoenix$ svm-predict BACMQ100UCIDC30.txt BACMQ100UCIDC05.txt.model
testQ100UCIDC05TC30.txt
Accuracy = 98.58% (2638/2676)
(classification)
Phoenix:windows Phoenix$ svm-predict BACMQ100UCIDC50.txt BACMQ100UCIDC05.txt.model
testQ100UCIDC05TC50.txt
Accuracy = 98.6547% (2640/2676)
(classification)
%
cross validation test that tested by BACMQ100UCIDC10.txt.model for all
test dataset
Phoenix:windows Phoenix$ svm-predict BACMQ100UCIDC01.txt BACMQ100UCIDC10.txt.model
testQ100UCIDC10TC01.txt
Accuracy = 79.5217% (2128/2676)
(classification)
Phoenix:windows Phoenix$ svm-predict BACMQ100UCIDC02.txt BACMQ100UCIDC10.txt.model
testQ100UCIDC10TC02.txt
Accuracy = 84.3423% (2257/2676)
(classification)
Phoenix:windows Phoenix$ svm-predict BACMQ100UCIDC05.txt BACMQ100UCIDC10.txt.model
testQ100UCIDC10TC05.txt
Accuracy = 91.704% (2454/2676)
(classification)
Phoenix:windows Phoenix$ svm-predict BACMQ100UCIDC10.txt BACMQ100UCIDC10.txt.model
testQ100UCIDC10TC10.txt
Accuracy = 97.4215% (2607/2676)
(classification)
Phoenix:windows Phoenix$ svm-predict BACMQ100UCIDC20.txt BACMQ100UCIDC10.txt.model
testQ100UCIDC10TC20.txt
Accuracy = 98.3931% (2633/2676)
(classification)
Phoenix:windows Phoenix$ svm-predict BACMQ100UCIDC30.txt BACMQ100UCIDC10.txt.model
testQ100UCIDC10TC30.txt
Accuracy = 98.9163% (2647/2676)
(classification)
Phoenix:windows Phoenix$ svm-predict BACMQ100UCIDC50.txt BACMQ100UCIDC10.txt.model
testQ100UCIDC10TC50.txt
Accuracy = 99.0284% (2650/2676)
(classification)
%
cross validation test that tested by BACMQ100UCIDC20.txt.model for all
test dataset
Phoenix:windows Phoenix$ svm-predict BACMQ100UCIDC01.txt BACMQ100UCIDC20.txt.model
testQ100UCIDC20TC01.txt
Accuracy = 68.3109% (1828/2676)
(classification)
Phoenix:windows Phoenix$ svm-predict BACMQ100UCIDC02.txt BACMQ100UCIDC20.txt.model
testQ100UCIDC20TC02.txt
Accuracy = 72.6831% (1945/2676)
(classification)
Phoenix:windows Phoenix$ svm-predict BACMQ100UCIDC05.txt BACMQ100UCIDC20.txt.model
testQ100UCIDC20TC05.txt
Accuracy = 84.6786% (2266/2676)
(classification)
Phoenix:windows Phoenix$ svm-predict BACMQ100UCIDC10.txt BACMQ100UCIDC20.txt.model
testQ100UCIDC20TC10.txt
Accuracy = 93.2362% (2495/2676)
(classification)
Phoenix:windows Phoenix$ svm-predict BACMQ100UCIDC20.txt BACMQ100UCIDC20.txt.model
testQ100UCIDC20TC20.txt
Accuracy = 98.8042% (2644/2676)
(classification)
Phoenix:windows Phoenix$ svm-predict BACMQ100UCIDC30.txt BACMQ100UCIDC20.txt.model
testQ100UCIDC20TC30.txt
Accuracy = 99.1031% (2652/2676)
(classification)
Phoenix:windows Phoenix$ svm-predict BACMQ100UCIDC50.txt BACMQ100UCIDC20.txt.model
testQ100UCIDC20TC50.txt
Accuracy = 99.29% (2657/2676)
(classification)
%
cross validation test that tested by BACMQ100UCIDC30.txt.model for all
test dataset
Phoenix:windows Phoenix$ svm-predict BACMQ100UCIDC01.txt BACMQ100UCIDC30.txt.model
testQ100UCIDC30TC01.txt
Accuracy = 58.4081% (1563/2676)
(classification)
Phoenix:windows Phoenix$ svm-predict BACMQ100UCIDC02.txt BACMQ100UCIDC30.txt.model
testQ100UCIDC30TC02.txt
Accuracy = 63.154% (1690/2676)
(classification)
Phoenix:windows Phoenix$ svm-predict BACMQ100UCIDC05.txt BACMQ100UCIDC30.txt.model
testQ100UCIDC30TC05.txt
Accuracy = 74.6263% (1997/2676)
(classification)
Phoenix:windows Phoenix$ svm-predict BACMQ100UCIDC10.txt BACMQ100UCIDC30.txt.model
testQ100UCIDC30TC10.txt
Accuracy = 86.0987% (2304/2676)
(classification)
Phoenix:windows Phoenix$ svm-predict BACMQ100UCIDC20.txt BACMQ100UCIDC30.txt.model
testQ100UCIDC30TC20.txt
Accuracy = 95.3662% (2552/2676)
(classification)
Phoenix:windows Phoenix$ svm-predict BACMQ100UCIDC30.txt BACMQ100UCIDC30.txt.model
testQ100UCIDC30TC30.txt
Accuracy = 99.2526% (2656/2676)
(classification)
Phoenix:windows Phoenix$ svm-predict BACMQ100UCIDC50.txt BACMQ100UCIDC30.txt.model
testQ100UCIDC30TC50.txt
Accuracy = 99.4395% (2661/2676)
(classification)
%
cross validation test that tested by BACMQ100UCIDC50.txt.model for all
test dataset
Phoenix:windows Phoenix$ svm-predict BACMQ100UCIDC01.txt BACMQ100UCIDC50.txt.model
testQ100UCIDC50TC01.txt
Accuracy = 52.0553% (1393/2676)
(classification)
Phoenix:windows Phoenix$ svm-predict BACMQ100UCIDC02.txt BACMQ100UCIDC50.txt.model
testQ100UCIDC50TC02.txt
Accuracy = 53.0269% (1419/2676)
(classification)
Phoenix:windows Phoenix$ svm-predict BACMQ100UCIDC05.txt BACMQ100UCIDC50.txt.model
testQ100UCIDC50TC05.txt
Accuracy = 58.1465% (1556/2676)
(classification)
Phoenix:windows Phoenix$ svm-predict BACMQ100UCIDC10.txt BACMQ100UCIDC50.txt.model
testQ100UCIDC50TC10.txt
Accuracy = 68.2362% (1826/2676)
(classification)
Phoenix:windows Phoenix$ svm-predict BACMQ100UCIDC20.txt BACMQ100UCIDC50.txt.model
testQ100UCIDC50TC20.txt
Accuracy = 84.716% (2267/2676)
(classification)
Phoenix:windows Phoenix$ svm-predict BACMQ100UCIDC30.txt BACMQ100UCIDC50.txt.model
testQ100UCIDC50TC30.txt
Accuracy = 94.6188% (2532/2676)
(classification)
Phoenix:windows Phoenix$ svm-predict BACMQ100UCIDC50.txt BACMQ100UCIDC50.txt.model
testQ100UCIDC50TC50.txt
Accuracy = 99.6263% (2666/2676)
(classification)
%
cross validation test, tested by 7 models, including the mixed set itself.
Phoenix:windows Phoenix$ svm-predict BACMQ100Mixed7C.txt
BACMQ100UCIDC01.txt.model testQ100UCIDC01TCMixed7.txt
Accuracy = 95.7399% (2562/2676)
(classification)
Phoenix:windows Phoenix$ svm-predict BACMQ100Mixed7C.txt
BACMQ100UCIDC02.txt.model testQ100UCIDC02TCMixed7.txt
Accuracy = 95.5157% (2556/2676)
(classification)
Phoenix:windows Phoenix$ svm-predict BACMQ100Mixed7C.txt
BACMQ100UCIDC05.txt.model testQ100UCIDC05TCMixed7.txt
Accuracy = 95.2541% (2549/2676)
(classification)
Phoenix:windows Phoenix$ svm-predict BACMQ100Mixed7C.txt
BACMQ100UCIDC10.txt.model testQ100UCIDC10TCMixed7.txt
Accuracy = 92.3767% (2472/2676)
(classification)
Phoenix:windows Phoenix$ svm-predict BACMQ100Mixed7C.txt
BACMQ100UCIDC20.txt.model testQ100UCIDC20TCMixed7.txt
Accuracy = 86.9955% (2328/2676)
(classification)
Phoenix:windows Phoenix$ svm-predict BACMQ100Mixed7C.txt
BACMQ100UCIDC30.txt.model testQ100UCIDC30TCMixed7.txt
Accuracy = 81.6891% (2186/2676)
(classification)
Phoenix:windows Phoenix$ svm-predict BACMQ100Mixed7C.txt
BACMQ100UCIDC50.txt.model testQ100UCIDC50TCMixed7.txt
Accuracy = 73.7294% (1973/2676)
(classification)
Phoenix:windows Phoenix$ svm-predict BACMQ100Mixed7C.txt
BACMQ100Mixed7C.txt.model testQ100UCIDCMixed7TCMixed7.txt
Accuracy = 96.0762% (2571/2676)
(classification)
%
cross validation test, tested by the mixed set.
Phoenix:windows Phoenix$ svm-predict BACMQ100UCIDC01.txt BACMQ100Mixed7C.txt.model
testQ100UCIDCMixed7TC01.txt
Accuracy = 88.0045% (2355/2676)
(classification)
Phoenix:windows Phoenix$ svm-predict BACMQ100UCIDC02.txt BACMQ100Mixed7C.txt.model
testQ100UCIDCMixed7TC02.txt
Accuracy = 90.1719% (2413/2676)
(classification)
Phoenix:windows Phoenix$ svm-predict BACMQ100UCIDC05.txt BACMQ100Mixed7C.txt.model
testQ100UCIDCMixed7TC05.txt
Accuracy = 94.4694% (2528/2676)
(classification)
Phoenix:windows Phoenix$ svm-predict BACMQ100UCIDC10.txt BACMQ100Mixed7C.txt.model
testQ100UCIDCMixed7TC10.txt
Accuracy = 96.9731% (2595/2676)
(classification)
Phoenix:windows Phoenix$ svm-predict BACMQ100UCIDC20.txt BACMQ100Mixed7C.txt.model
testQ100UCIDCMixed7TC20.txt
Accuracy = 98.5426% (2637/2676)
(classification)
Phoenix:windows Phoenix$ svm-predict BACMQ100UCIDC30.txt BACMQ100Mixed7C.txt.model
testQ100UCIDCMixed7TC30.txt
Accuracy = 98.9537% (2648/2676)
(classification)
Phoenix:windows Phoenix$ svm-predict BACMQ100UCIDC50.txt BACMQ100Mixed7C.txt.model
testQ100UCIDCMixed7TC50.txt
Accuracy = 99.0658% (2651/2676)
(classification)
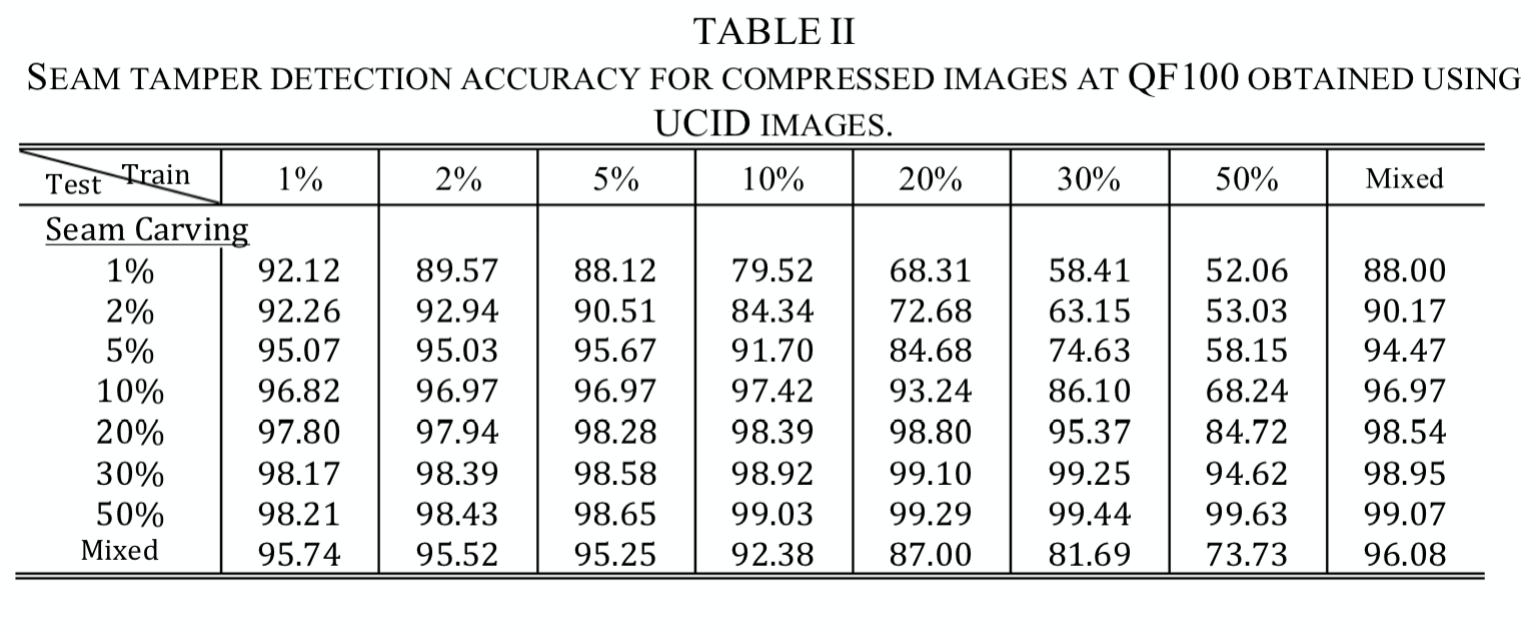
8.
Report the
tamper detection accuracy for seam carving detection for compressed images at
QF100 as in Table II.